For factories operating machinery seven days a week, maintaining quality and delivering products on schedule are essential priorities. Yet while machines keep production moving, some energy may be wasted without anyone noticing. Taking part in SIMTEC’s Green Transformation programme prompted Mr. Prateep Wapitha, Deputy Quality Manager at Qijing Industry (Thailand) Co., Ltd., to look at the factory from a new perspective: How well does the factory understand its machines’ energy consumption, and how can existing data turn hidden losses into opportunities for improvement?
Stable machine performance, products that meet specifications, and the ability to fulfil orders continuously are all strong indicators of manufacturing readiness. But another question remains: How much energy do the machines consume during operation, and are there costs the factory has yet to see?
MEGA Tech spoke with Mr. Prateep Wapitha, Deputy Quality Manager at Qijing Industry (Thailand) Co., Ltd., a CNC machining company with more than 200 employees that exports all its products to the United States. He shared his experience after attending the Green Transformation for Next-Generation Factory Leaders programme at Sumipol Institute of Manufacturing Technology (SIMTEC). A key theme was how to make deeper use of data across quality, production processes and energy.
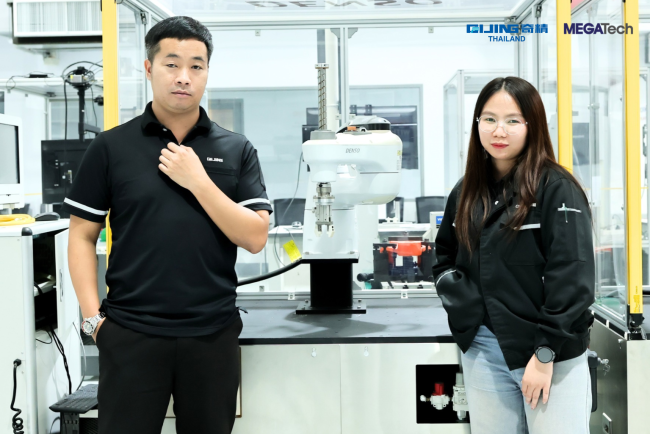
Mr. Prateep Wapitha, Deputy Quality Manager, Qijing Industry (Thailand) Co., Ltd.
From Specialised Knowledge to a Factory-Wide Perspective
Before joining the programme, Mr. Prateep already had a foundation in and experience with IoT, and had previously studied CNC-related topics with SIMTEC. However, he had not yet explored Green Transformation as an integrated approach that connects the different elements of factory operations.
The SEEN → LEAN → GREEN → CLEAN framework helped clarify the relationship between data, waste, production efficiency and resource consumption. Rather than viewing problems in isolation, participants could begin to understand how issues in one process affect the factory as a whole.

One of the programme’s key benefits was learning to revisit the shop floor with more probing questions: What data is the factory already collecting? What information is missing? And how should these data points be connected to identify root causes and select the right improvement measures?
Extending Quality Dashboards to Energy Data
The company already uses production data to monitor quality, with some information available in real time. One example is Statistical Process Control (SPC), which helps teams track trends in the stability of key customer-specified characteristics.
When an abnormality is detected, this information provides a starting point for investigating contributing factors—including people, machines, materials and working methods—in order to identify root causes and resolve the issue.
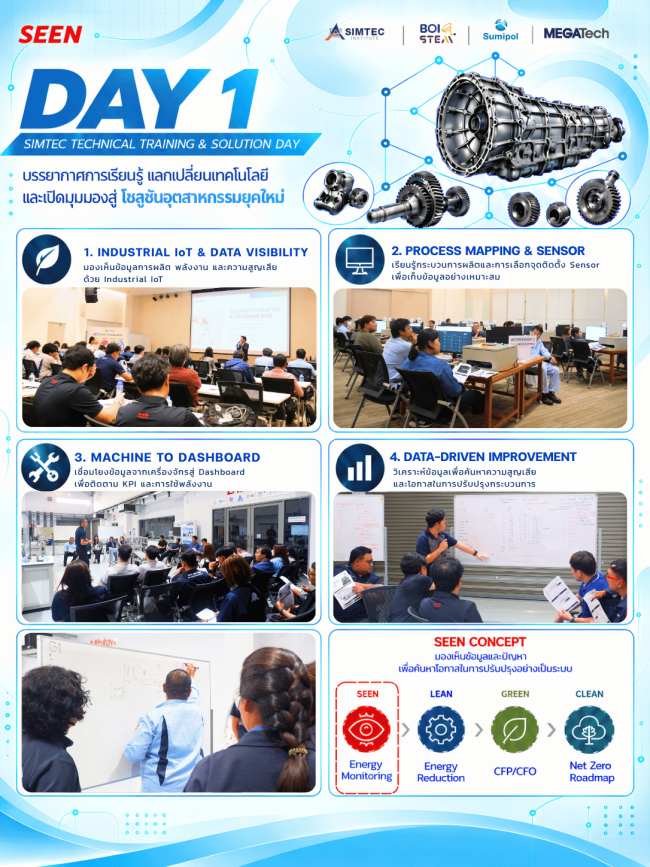
The training at SIMTEC highlighted an opportunity to extend dashboards beyond product quality by connecting production-process data with machine energy consumption. In addition to understanding how consistently a machine performs, the factory could examine how much energy it uses at different stages, when consumption peaks, and whether anomalies are adding unnecessary costs.
Viewing both sets of data together can make improvement efforts more precise. Even a machine that consistently produces parts to specification may still offer opportunities to reduce energy consumption during certain stages of operation.
Turning Stored Data into Better Decisions
Another priority is making better use of the data the factory already has—especially information still recorded on paper or stored in electronic files that have not yet been linked for systematic analysis.
The goal is not simply to add another dashboard. It is to review which data is essential for understanding a problem and how it should be presented so that operators, managers and executives can use it to support decisions.
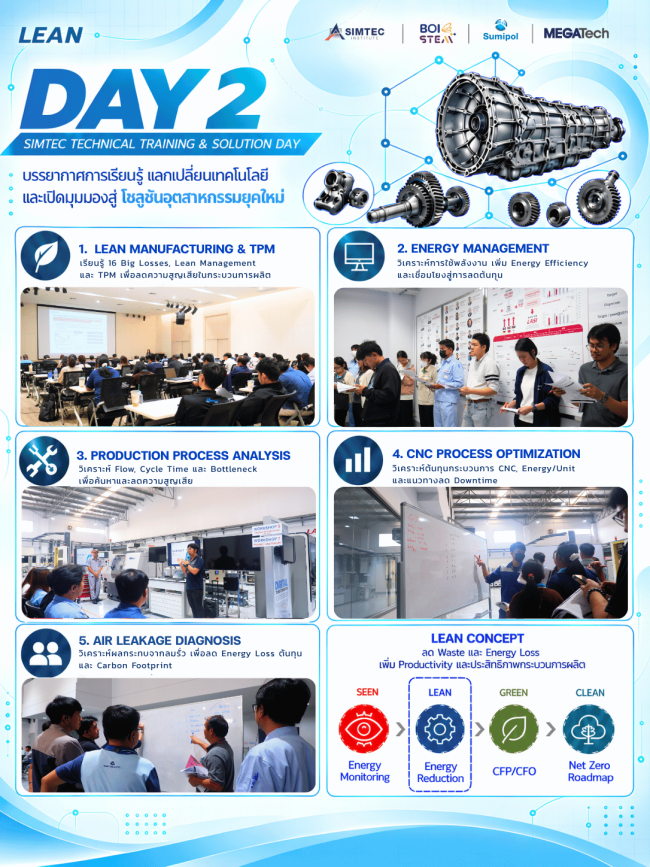
When shop-floor data is summarised effectively, management can identify priorities more clearly. At the same time, teams can provide feedback and improve the way data is collected so that it better serves operational needs.
A dashboard creates value when it helps teams understand where a problem is occurring, what needs further investigation and where corrective action should begin.
Unmeasured Losses May Be Happening Beside the Machines Every Day
For factories running machinery continuously, day and night, energy is an area where lessons from the programme may be applied relatively quickly.
Examples that prompted a fresh review of the shop floor included compressed-air leaks and the electricity consumed by machines at different stages—areas that may not previously have been measured in sufficient detail.
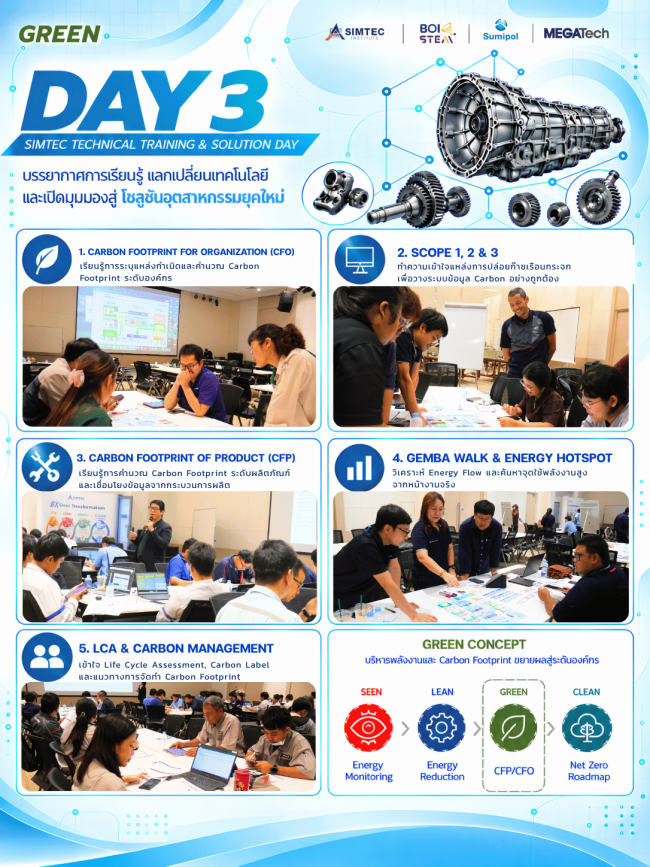
These examples raise an important question: What losses recur every day, yet remain difficult to quantify because there is no clear data showing their scale?
Mr. Prateep believes that installing measurement devices and displaying the resulting data could make it easier to assess problems objectively. Instead of simply suspecting that energy is being wasted, the factory could identify where to investigate and evaluate the potential cost impact.
This is an approach the company intends to develop after the training. Actual data will need to be measured before the scale of any losses or potential savings can be confirmed.
Start with Shop-Floor Challenges, Then Design the Right System
The next step under consideration is to consult further with the instructors and SIMTEC team about measurement devices, practical demonstrations and dashboard design suited to the factory’s specific context.
The key questions are whether to build on the existing system or develop a new component, and which energy data would give the team the clearest view of potential problems.
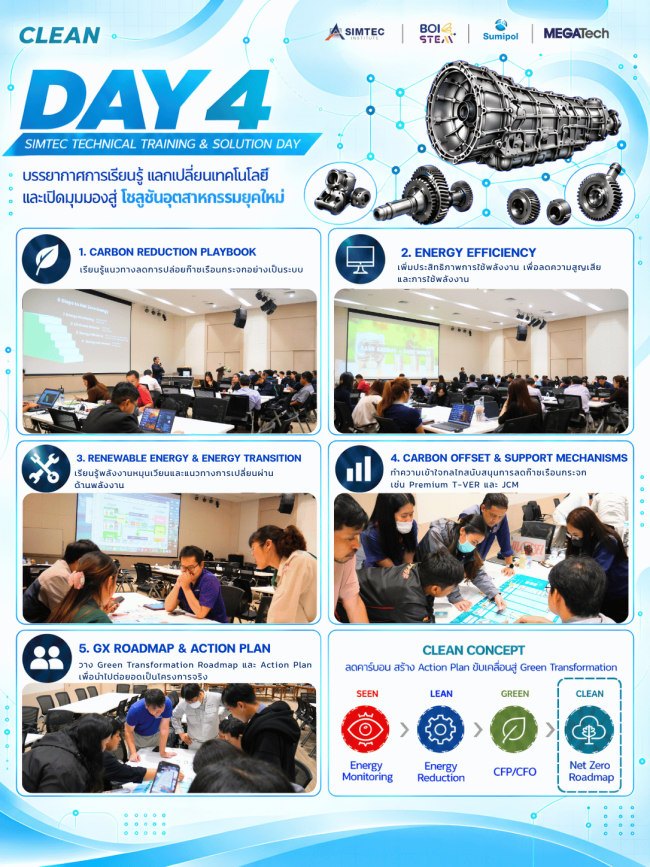
The programme helped give future technology discussions a clearer direction. Participants could better define what information they wanted to see, which problems they hoped to address and how the results could support improvement efforts.
Making losses visible is an important foundation for progressing towards GREEN and CLEAN. Without understanding how a factory uses energy and other resources, improvement plans may lack the data needed to support them.
Building Sustainability Readiness by Understanding Your Own Processes
As an automotive parts manufacturer exporting 100% of its products to the United States, Qijing Industry (Thailand) Co., Ltd. continues to prioritise customer quality requirements. At the same time, customers are paying increasing attention to sustainability and ESG.
Although the company has not yet received specific carbon-reduction targets, it anticipates that its US customers may set clearer requirements around the third quarter of 2027—making preparation increasingly important.
Understanding energy use, identifying losses and organising data systematically therefore offer both an opportunity to improve costs today and a foundation for responding to future sustainability expectations.
EXCLUSIVE TAKEAWAY |
Measure What Matters. Understand Clearly. Improve Precisely.
Green Transformation helps extend quality data into energy data, turning suspected losses into issues that can be measured and addressed—supporting greater efficiency, lower costs and a more sustainable manufacturing foundation.
Mr. Prateep Wapitha, Deputy Quality Manager
Qijing Industry (Thailand) Co., Ltd.